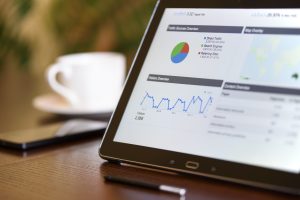
In recent years, AI and machine learning have transformed how we interact with data. From automating decision-making to predicting trends, these technologies are reshaping every industry. But one area where AI is particularly exciting is in visualizing data. Imagine being able to generate a photo or visual representation of earnings data, allowing decision-makers to gain insights quickly and intuitively. It’s not only possible but becoming increasingly prevalent in business intelligence.
If you’re wondering how AI can be leveraged to generate earnings visualizations, you’re in the right place. This article will walk you through the intricate process of using AI models to generate photos or images of earnings data and discuss the benefits, tools, and future implications of this innovation. Whether you’re in finance, marketing, or any field that requires analyzing numbers and trends, understanding AI’s potential to visualize earnings is crucial.
What Are AI Models, and How Do They Work in Visualizing Data?
To understand how AI can generate photos of earnings, you need a solid foundation of how AI models work. At their core, AI models are algorithms trained to recognize patterns in data. These models use machine learning techniques to learn from past data and predict or classify new data. In the context of data visualization, AI models can process vast amounts of data, recognize key trends, and generate images that represent those trends in visually meaningful ways.
AI-driven data visualization tools often use deep learning algorithms, like Convolutional Neural Networks (CNNs), to process complex data structures. These tools can then output visualizations such as graphs, charts, or even images that reflect the underlying data—like earnings reports, sales performance, or financial growth—capturing intricate details in a format that’s easy to understand.
You also may like to read this: How AI and Automation Streamline Data Management
How AI Models Generate Photos of Earnings Data
1. AI and Data Processing
The first step in generating photos of earnings is the data collection and processing phase. Companies generate massive amounts of earnings data daily, from revenue and expenses to profit margins and growth rates. This data can often be unstructured or hidden in different formats (e.g., spreadsheets, financial reports, databases).
AI models begin by aggregating this data from various sources. Through natural language processing (NLP), these models can extract valuable financial data from text documents or reports, while data mining techniques pull data from databases and cloud storage.
2. Analyzing Data for Trends
Once the data is aggregated, AI models analyze it for patterns. For earnings data, AI looks for key performance indicators (KPIs) such as revenue growth, profit margins, year-over-year comparisons, and other relevant metrics. The machine learning algorithms, particularly supervised learning, identify trends, anomalies, and correlations within the dataset.
For instance, AI might identify a sudden spike in earnings for a particular quarter or observe a consistent upward trend in profits over the past few years. The AI then organizes this information into a visual format, ready for rendering.
3. Generating Visuals: Creating Photos of Earnings
AI models then utilize image generation techniques to create visuals that represent the earnings data. These visuals can range from simple bar graphs and pie charts to more sophisticated visual representations such as heat maps, data-driven art, or 3D visualizations.
To generate a photo specifically, AI models can create a data-driven artwork that visually represents earnings using graphical elements like color gradients, shapes, and textures. This process may involve:
- Data Visualization Models: Specialized algorithms designed to translate numerical data into graphical or visual elements.
- Generative Adversarial Networks (GANs): Used in more advanced scenarios, GANs can generate high-quality synthetic images that reflect specific financial trends or earnings scenarios.
Benefits of Using AI to Generate Earnings Photos
1. Simplifying Complex Data
Data, especially earnings data, can be incredibly complex. AI models simplify these complexities by turning raw numbers into visual narratives. By generating photos of earnings, AI enables businesses to quickly digest insights and make data-driven decisions without wading through endless spreadsheets.
2. Enhancing Decision-Making
Visualization is a powerful tool for decision-making. When you can see earnings data in a visually intuitive format—like a photo—it’s much easier to identify key trends or potential issues. AI-generated visuals bring clarity to financial reports, providing a clear overview of the organization’s performance over time.
3. Predictive Insights
AI models don’t just generate photos of historical earnings; they can also predict future earnings based on trends. By analyzing patterns in the data, AI can forecast future growth, highlight potential downturns, and provide actionable insights that can inform strategy.
4. Customization
AI-generated earnings visuals can be tailored to meet the needs of different stakeholders. Whether you’re presenting to senior executives, investors, or team members, AI allows you to customize the visuals to focus on the most relevant KPIs or metrics, ensuring that your audience gets exactly the information they need.
Tech Specs of AI Models for Generating Earnings Photos
AI models used for generating earnings data visuals come with an array of technical specifications that make them powerful tools:
- Machine Learning Algorithms: AI models use advanced machine learning algorithms like random forests, deep learning, and neural networks to analyze complex datasets.
- Generative Networks: Advanced models like Generative Adversarial Networks (GANs) or Variational Autoencoders (VAEs) are used to generate realistic and creative visual representations of data.
- Data Visualization Tools: Tools like Tableau, Power BI, or Matplotlib integrate AI to generate clear, insightful visualizations of earnings and financial data.
- Cloud-Based Platforms: Many AI data visualization tools are hosted on cloud platforms, allowing them to scale quickly and handle large datasets seamlessly.
Comparison Table: Traditional Data Visualization vs. AI-Generated Photos
| Feature | AI-Generated Photos of Earnings | Traditional Data Visualization |
| Data Processing | Automated, fast, AI-enhanced | Manual, slower, human-dependent |
| Accuracy | Highly accurate, error-free | Prone to human errors and inconsistencies |
| Scalability | Can scale to handle vast datasets | Struggles with large datasets |
| Visual Appeal | Dynamic, creative, visually rich | Standard graphs, limited creativity |
| Predictive Insights | Can generate future trends visually | Typically focuses on past data |
Pros and Cons of AI-Generated Earnings Photos
Pros:
- Speed: AI can process and visualize earnings data in a fraction of the time it would take a human.
- Accuracy: AI eliminates human error in both data analysis and visualization.
- Real-time Insights: AI can generate photos in real-time, enabling businesses to make quicker decisions.
- Customization: AI offers a high degree of customization for visuals, ensuring they meet specific stakeholder needs.
Cons:
- Initial Setup: Setting up AI models and integrating them with your data can be complex and time-consuming.
- Data Privacy: Handling sensitive earnings data with AI requires robust security measures to protect confidentiality.
- Cost: Advanced AI models and tools can be expensive to implement, particularly for smaller businesses.
Recommendations for Implementing AI in Earnings Data Visualization
- Choose the Right Tool: Depending on your business’s needs, consider using specialized tools like Google Cloud AI, Power BI, or Tableau that support AI-based data visualization.
- Integrate AI Gradually: Start by using AI for simpler tasks like generating earnings reports or financial dashboards and scale up as needed.
- Ensure Data Security: Use encrypted data storage and comply with relevant regulations like GDPR when dealing with financial data.


